In this article, you will learn how to use Mermaid in MediaWiki to draw various diagrams and charts.
Creating Mermaid Diagrams
Mermaid is a powerful tool for creating diagrams and visualizations using text-based descriptions.
To create a Mermaid diagram in your MediaWiki page, use the #mermaid parser function. Here's the basic syntax:
{{#mermaid:diagramType
  Your diagram code goes here
}}
Let's look at how to create three common types of diagrams:
1. Class Diagram
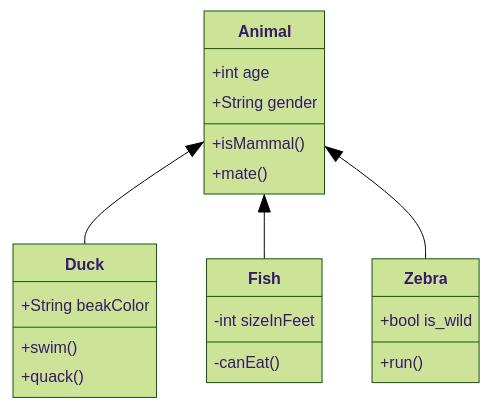
Class diagrams describe the structure of a system by showing classes, attributes, methods, and relationships among objects.
Here's an example of a simple class diagram:
{{#mermaid:classDiagram
    Animal <|-- Duck
    Animal <|-- Fish
    Animal <|-- Zebra
    Animal : +int age
    Animal : +String gender
    Animal: +isMammal()
    Animal: +mate()
    class Duck{
      +String beakColor
      +swim()
      +quack()
    }
    class Fish{
      -int sizeInFeet
      -canEat()
    }
    class Zebra{
      +bool is_wild
      +run()
    }
}}
This diagram shows an Animal class with three subclasses: Duck, Fish, and Zebra. Each class has its own attributes and methods.
2. Subgraph
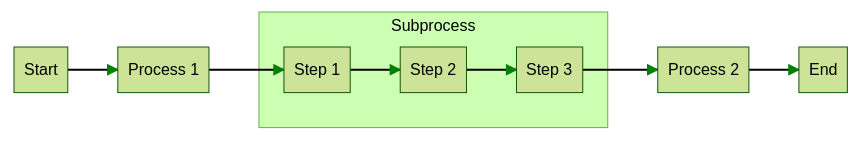
Subgraphs group related nodes in a flowchart or other diagram types. They can be used to organize complex diagrams and show process hierarchies.
Here's an example of a horizontal subgraph:
{{#mermaid:graph LR
    A[Start] --> B[Process 1]
    subgraph Subprocess
    C[Step 1] --> D[Step 2] --> E[Step 3]
    end
    B --> C
    E --> F[Process 2]
    F --> G[End]
}}
This diagram shows a flowchart with a horizontal subgraph. The main flow goes from Start to Process 1, then into a Subprocess (containing Steps 1, 2, and 3), continues to Process 2, and finally to End.
3. Gantt Chart
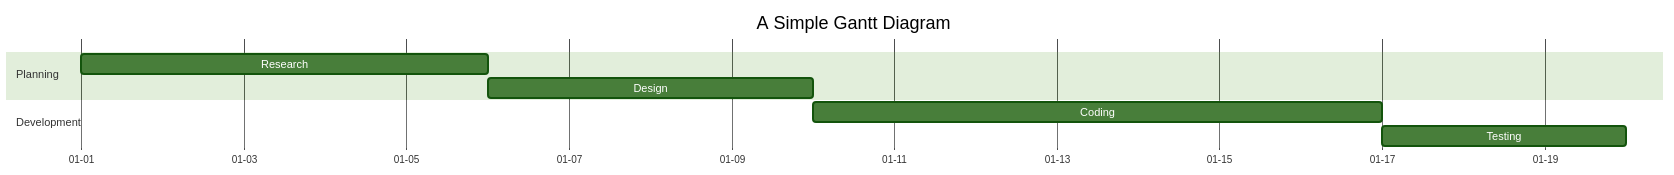
Gantt charts are used in project management to show the start, end, and duration of tasks in a project.
Here's an example of a Gantt chart:
{{#mermaid:gantt
    title A Simple Gantt Diagram
    dateFormat  YYYY-MM-DD
    axisFormat %m-%d
    section Planning
    Research      :a1, 2023-01-01, 5d
    Design        :a2, 2023-01-06, 4d
    section Development
    Coding        :a3, 2023-01-10, 7d
    Testing       :a4, 2023-01-17, 3d
}}
This Gantt chart shows a simple project timeline with two sections (Planning and Development), each containing two tasks.
Tips for Using Mermaid
- Syntax: Mermaid uses specific syntax for each diagram type. Refer to the Mermaid documentation for detailed syntax guides.
- Previewing: You can preview your Mermaid diagrams using the Mermaid Live Editor before adding them to your wiki.
- Complexity: Start with simple diagrams and gradually increase complexity as you become more familiar with Mermaid syntax.
- Maintenance: Remember that diagrams are part of your wiki content. Keep them updated as your information changes.
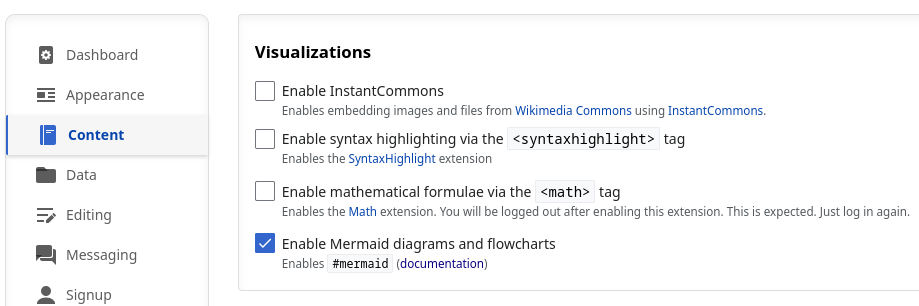
Enabling Mermaid on ProWiki
To enable Mermaid on ProWiki:
- Log in as administrator
- Go to the Admin Panel
- Navigate to the Content tab
- Enable Mermaid in the Visualizations section
Conclusion
By using Mermaid, you can create clear, visually appealing diagrams that enhance the content of your MediaWiki pages. This tool is particularly useful for technical documentation, project management, and system design.